Google Analytics 4 in plain English: five reports worth checking every month.
GA4 can feel overwhelming. You don't need most of it. Five reports that tell a business owner how their website is really doing, and how to read them.
Google Analytics 4 replaced Universal Analytics in 2023, and plenty of business owners haven't really looked at it since. It's easy to see why. GA4 is built for analysts, its menus are full of options, and the numbers don't look like the old ones.
The good news is that you don't need most of it. A handful of reports will tell you where visitors come from, what they look at and whether they get in touch or buy. This guide covers the five we'd check every month, what to look for in each, and how to make sure the most important number, your enquiries or sales, is being tracked at all.
Google changes GA4's menus from time to time, so names may differ slightly from what you see. The ideas stay the same.
Three terms worth knowing first
- Session: a visit to your website. One person can have several sessions.
- Engaged session: a visit where someone stayed longer than 10 seconds, viewed two or more pages, or completed a key event. The engagement rate is the share of sessions that were engaged, and it's more useful than the old bounce rate.
- Key event: an action that matters to your business, such as an enquiry, a booking or a purchase. Google used to call these conversions.
Before anything else: track your key events
If GA4 doesn't know when someone sends an enquiry or buys something, the other reports can only tell you about traffic, not results. Check this first.
- 1 In GA4, open Admin, then Events (under Data display), and look at the list of events your site sends.
- 2 Find the event that fires when someone completes your most important action. Online shops connected properly will usually have purchase. For enquiry forms, it's often an event sent from your thank-you page or form tool.
- 3 Mark that event as a key event.
- 4 If no suitable event exists, it needs setting up, usually through Google Tag Manager or your platform's GA4 integration. GA4's automatic form tracking records that a form was started or submitted, but not whether the submission succeeded, so a dedicated event is more reliable.
If your forms send leads into a CRM, it's worth tracking them there too. Our article on HubSpot automations every website needs shows how leads can be followed up automatically.
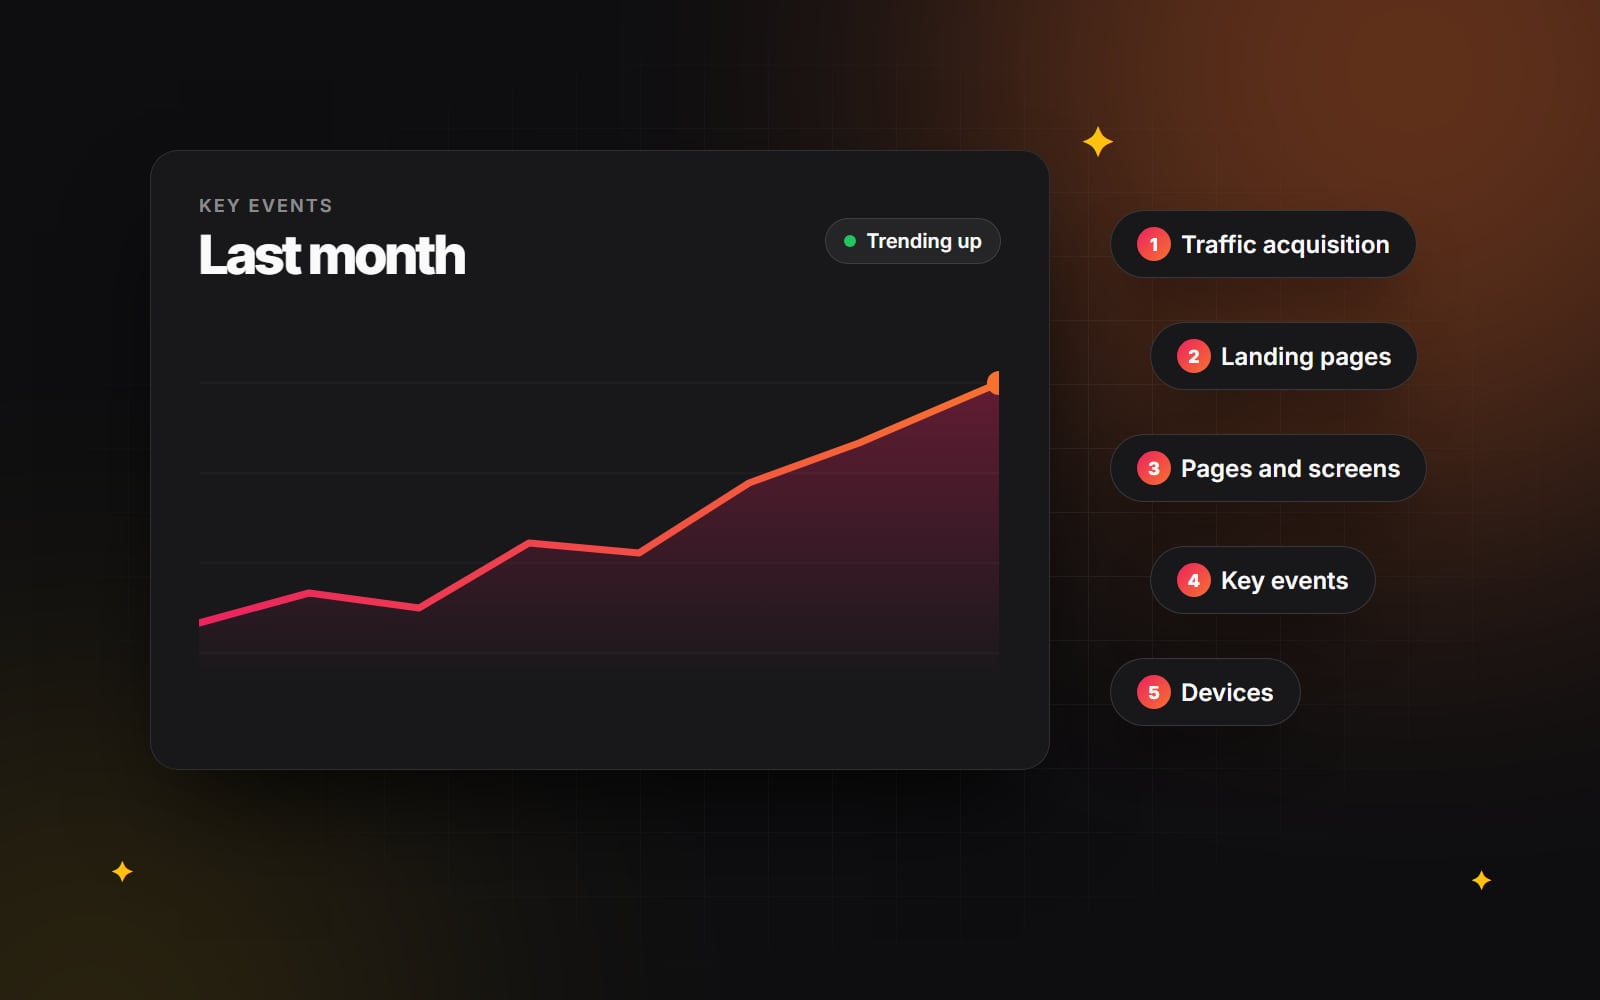
1. Traffic acquisition: where visits come from
Reports → Acquisition → Traffic acquisition groups your sessions by channel: Organic Search, Direct, Referral, Paid Search, Organic Social, Email and so on.
Look at which channels bring the most engaged sessions and key events, not just the most visits. A channel with modest traffic but a high share of enquiries deserves more attention than one with lots of quick visits that go nowhere. Compare with the previous month and the same month last year to account for seasonal changes.
2. Landing pages: where visits start
Reports → Engagement → Landing page shows the first page people see in each session. These pages make your first impression, and they're usually your blog posts, service pages and homepage.
Look for pages that attract lots of visits but have a low engagement rate. They're your best opportunities: people arrive, but something about the page doesn't hold them. Slow loading is a common cause, which our guide to Core Web Vitals explains how to check.
3. Pages and screens: what people read
Reports → Engagement → Pages and screens shows every page with its views and average engagement time. Sort by views to see your most-read content, then check whether those pages lead somewhere useful, such as a related service page or your contact page.
4. Key events: what's working
Reports → Engagement → Events (or the key events report, depending on your version) shows how often each key event happened. Add a comparison by channel or landing page to see which sources and pages produce enquiries or sales, not just visits.
5. Tech: devices and browsers
Reports → Tech → Overview shows how many visitors use mobile, desktop and tablet. If most of your visitors are on phones but most of your enquiries come from desktop, the mobile experience may be getting in the way. Our article on mobile-first design and our guide to forms people actually finish are good places to start.
A 20-minute monthly routine
- 1 Set the date range to last month, and compare it with the month before and the same month last year.
- 2 In Traffic acquisition, note the channels that brought the most key events.
- 3 In Landing page, note two pages with lots of visits but low engagement, to improve this month.
- 4 In Pages and screens, check that your most-read pages link to your services and contact page.
- 5 In Events, check that key events are still being recorded. A sudden drop to zero usually means tracking broke, often after a website change.
- 6 Write three lines in a shared document: what changed, why you think it changed, and what you'll try next.
Common GA4 pitfalls
- Counting your own visits. Your team visits the website every day. Define your office IP address as internal traffic in the data stream settings and turn on the filter, so you're not measuring yourselves.
- Short data retention. By default, GA4 keeps detailed event data for two months, which limits the explorations you can build. Check Admin → Data retention and choose the longest period your plan allows. Standard reports aren't affected.
- Tracking that breaks quietly. A redesign, a new form tool or a cookie banner change can stop events firing without anyone noticing. Check key events after every website change.
- Spam and unknown referrals. If a strange site suddenly sends lots of short visits, it's usually bots. Look at engagement before celebrating a traffic spike.
Don't expect GA4 to match other tools exactly. Cookie consent choices, ad blockers and privacy settings all mean some visits aren't recorded, so treat the numbers as trends rather than exact counts.
Need tracking set up properly?
Good reporting starts with good tracking. We set up GA4, key events and CRM connections as part of our automation and integrations work, and for online stores as part of e-commerce optimisation. If you're not sure your website is measuring the right things, let us know.
Planning something similar?
Tell us what you're building and we'll come back with ideas and next steps.